Goal of the Project

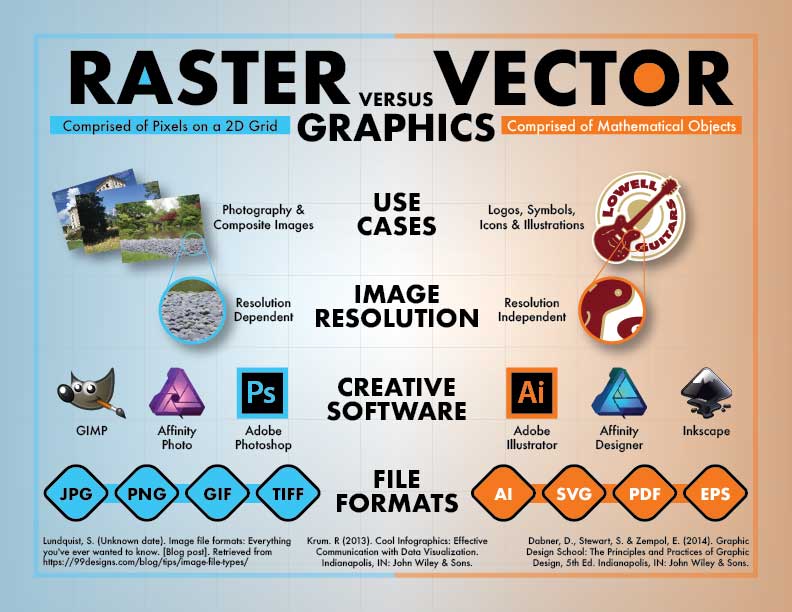
For the WGD 229 Information Design course at DeVry University in 2018, the topic of raster graphics versus vector graphics was discussed, researched, and finally displayed using an infographic design. The audience for this design is anyone concerned with graphic image formats. This infographic would be handy for a newer creative design professional seeking clarity on these two major types of image formats.

Project Specs

Category

  • Infographic
  • Page Layout

Software Used

  • Adobe Illustrator CC icon
  • Adobe InDesign CC icon
  • Adobe Photoshop CC icon

(click icon to view name)

Audience

  • Graphic Designers
  • General Audience of Computer Users

Solution to the Problem

This infographic was a product of researching these two major image formats. The infographic itself is a balanced, symmetrical design which takes advantage of proximity and color to clearly explain the different use cases, image resolution dependence (or independence), creative software used to create such an image, and a variety of file formats which these images fall under. The Raster side of the infographic is in the blue of the Photoshop icon and the Vector side is in the orange of the Illustrator icon.

Feedback From Others

"Thomas, another excellent submission for week 4's assignment which includes information about graphics and how the type of graphic used affects the overall presentation. Your research was complete and you clearly considered implications of each file type. I was very glad to see a structured and well-balanced infographic that incorporated a comparison of alternative graphics with clear titles and the subtle application of orange and blue starting from the background to the foreground where you carried over the contrasting information using the alternative sides of the pages. Comparing and contrasting two different categories can be accomplished in many creative ways and making one half of the page a different color background as you did further reinforce the differences."

- Eva Hamburger, DeVry University Instructor (2/2018)

"Tom, You always inspire me. Your infographic is very well done. The layout and attention to detail show you put a lot of time planning these out. The color scheme is great. I like the gradient background you worked in. The way you use graphics to present the information helped me get some ideas where I have been lacking. Thank you."

- Raymond Magner Jr., DeVry University Student (2/2018)